
Drivers of Demand
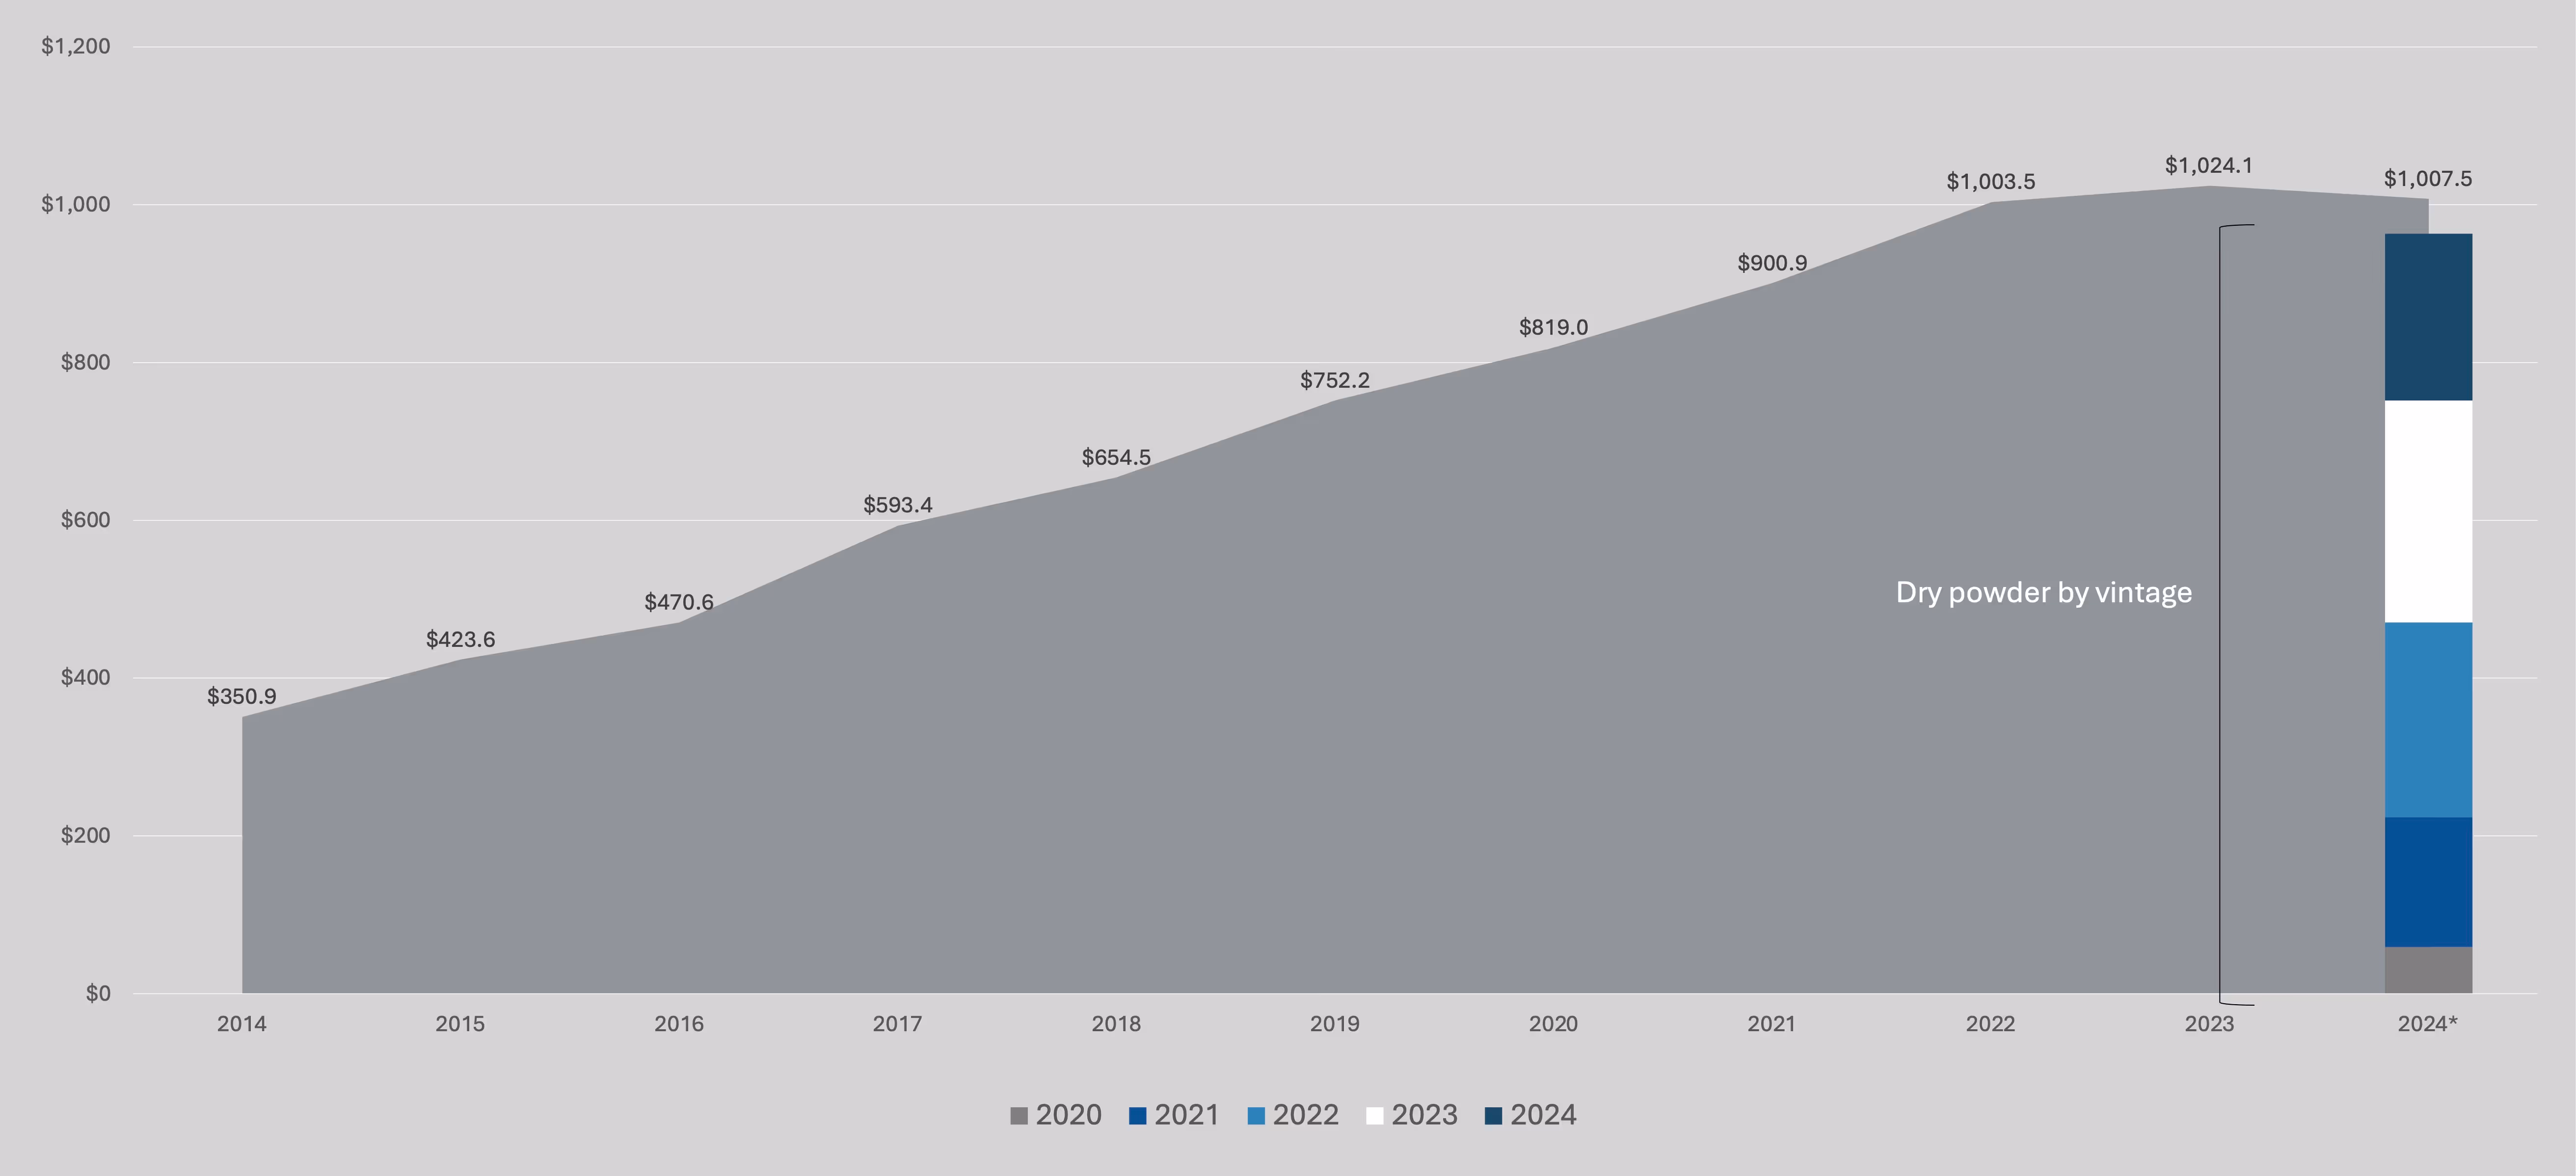
Dry powder, although above the $1T mark, has declined as a percentage of AUM to 28.4%, below the 10-year average of 36%.
The chart below indicates that over the next 2–3 years, the market will lose ~$470B of dry powder from funds with vintages of 2020–2022, although that loss is expected to be more than offset by future fundraising. For context, fundraising in 2024 was ~$285B.
What This Means for NAV Lending
A decline in dry powder will increase the need for funds to consider NAV facilities to provide capital to help grow or defend the value of existing portfolio companies. Even if sufficient new funds are raised, private equity sponsors will consider NAV loans as an elegant solution to cross-funding an investment across two separate funds.
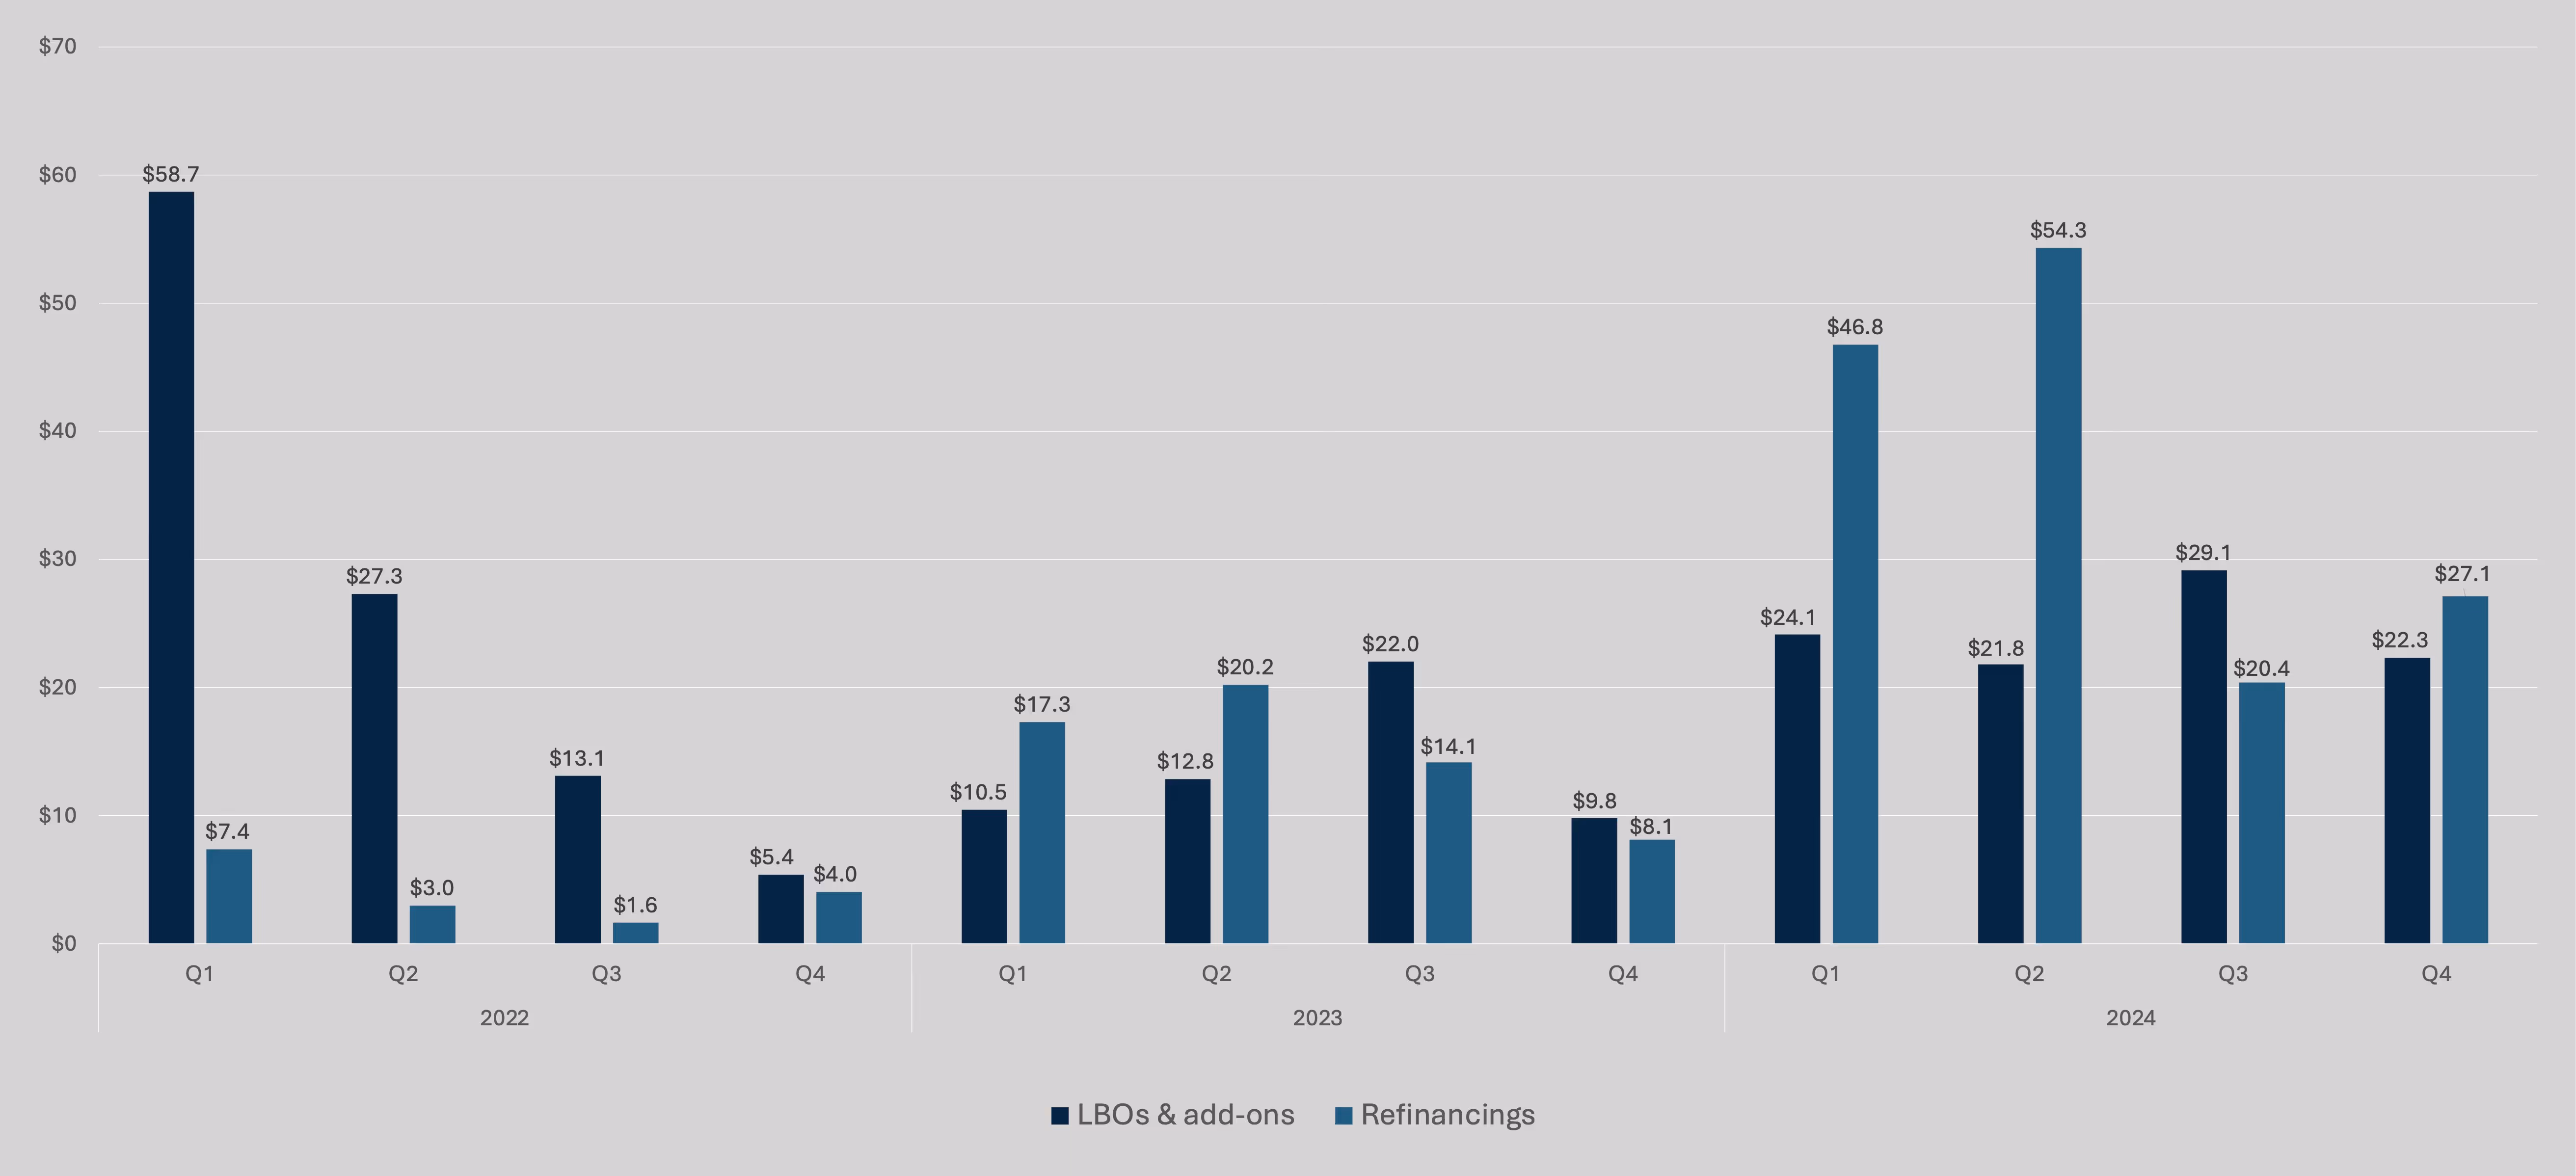
LBO financings saw banks re-entering the lending market and syndicated LBO loan volume reached ~$60.3B, a nearly 50% increase from $30.7B in 2023. Although banks are now competing with private credit lenders in the broadly syndicated loan (“BSL”) market as well, new activity mostly consists of refinancings as refinancings reached $259.3B by year-end in 2024. Historically, refinancings comprise ~one-third of BSL issuance, but the current share has grown to two-thirds.
Don’t be fooled by the headlines that claim the debt markets have fully rebounded; most of this activity has been attributable to refinancings.
Add-on acquisitions represented 74.1% of all PE buyouts, roughly in line with the five-year average of 73.5%. With add-on acquisitions being a common use case for NAV facilities, this will continue to be a growth driver for fund finance as sponsors look to create value through accretive M&A activity.
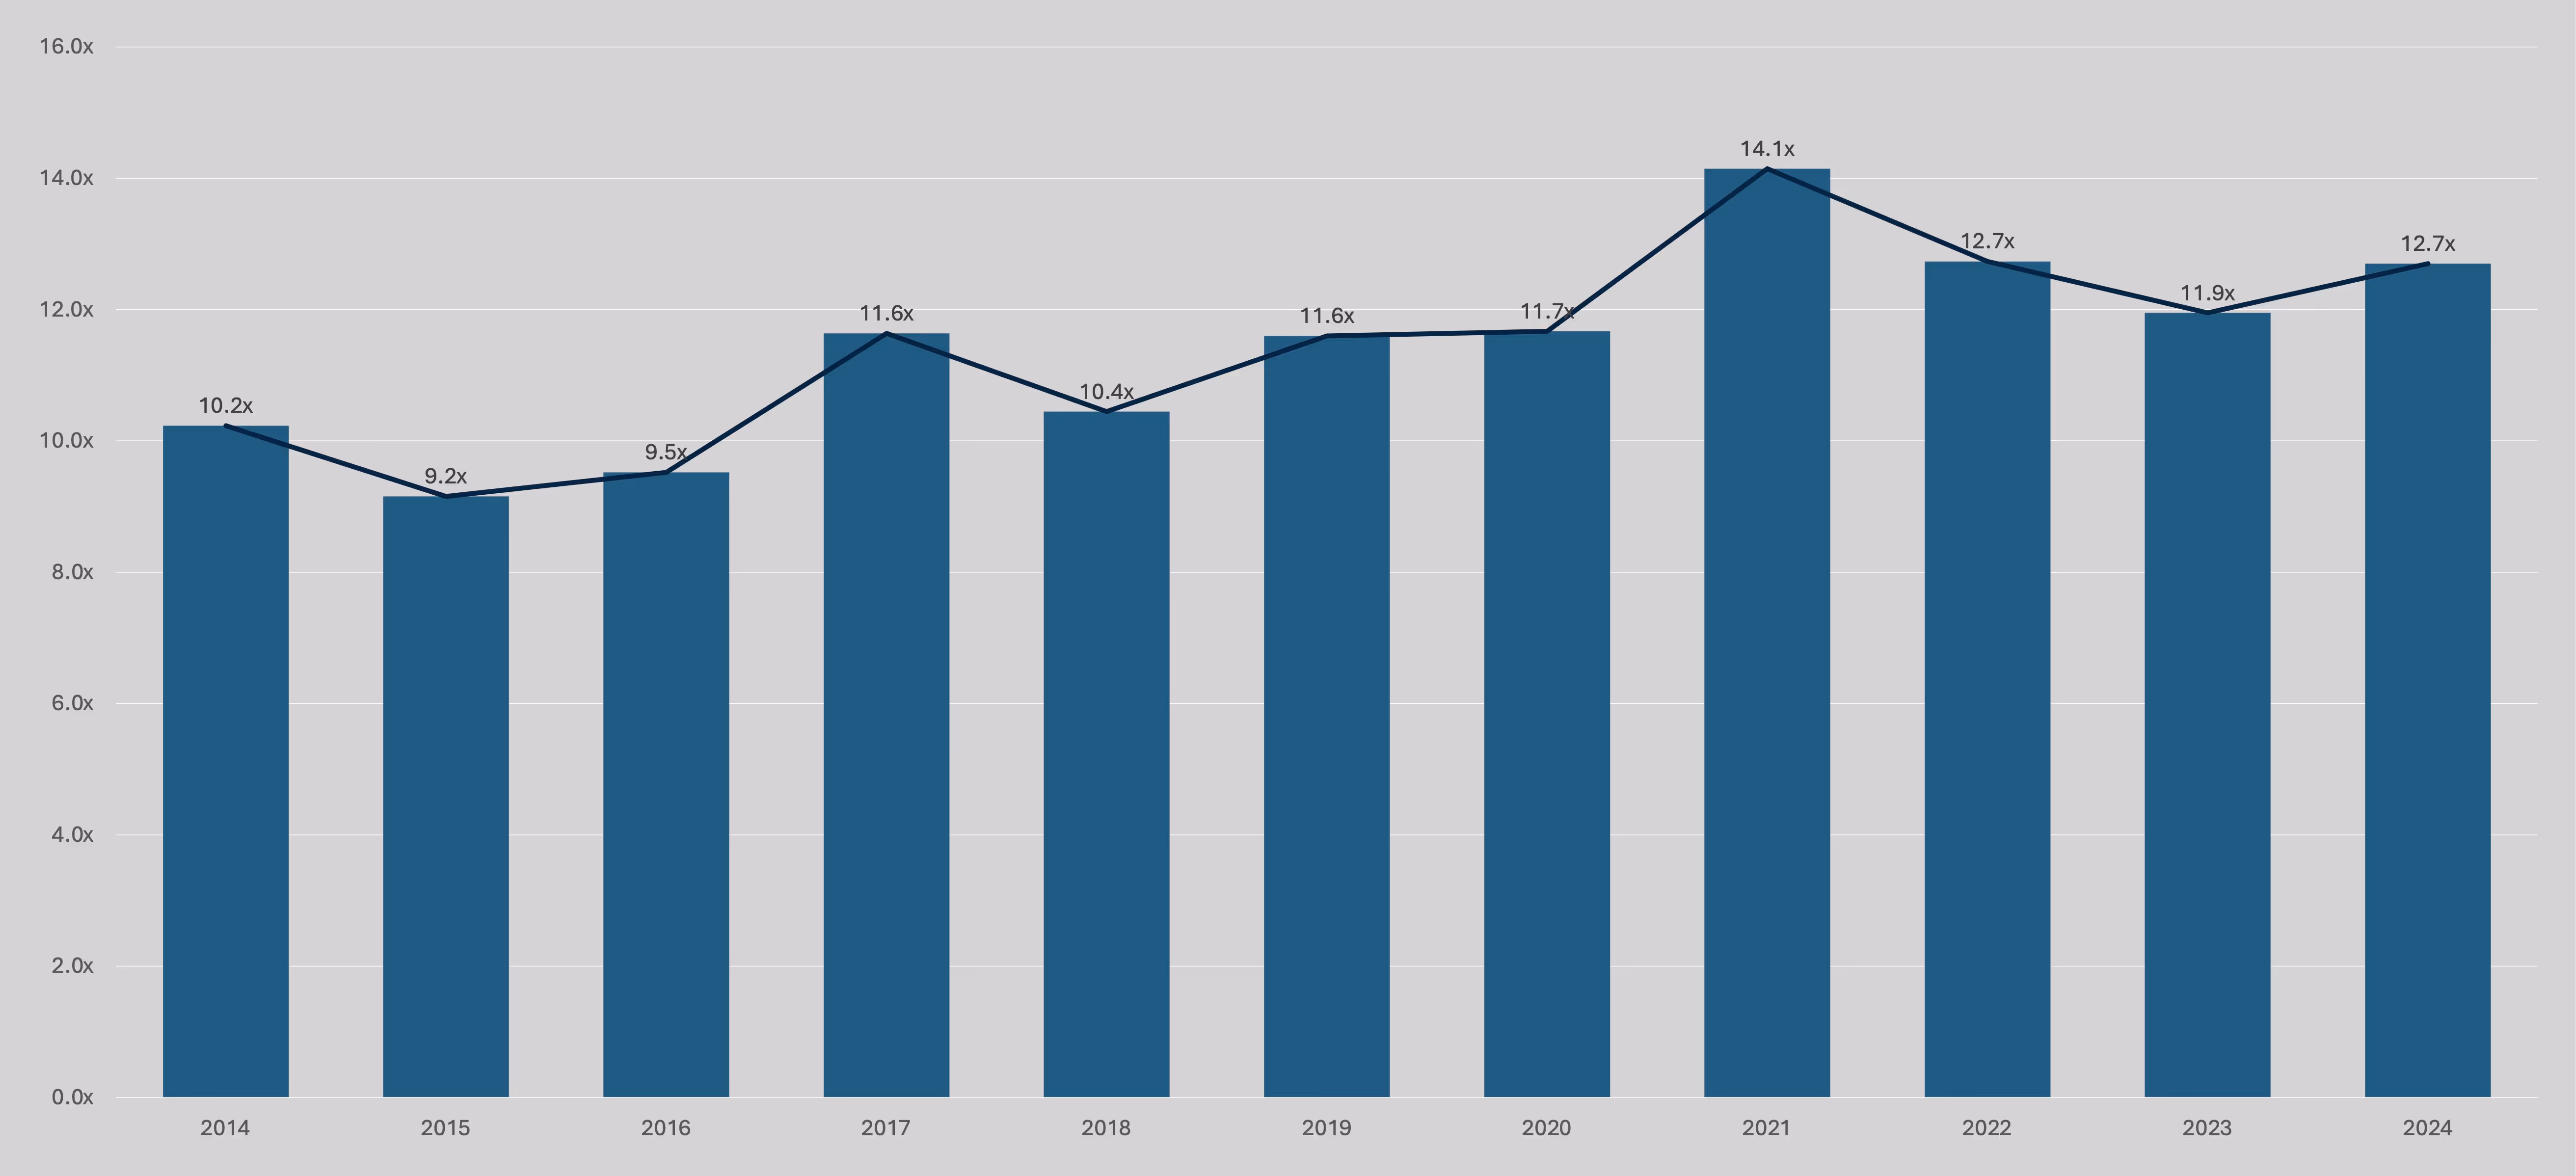
Exit activity improved by ~49% in value and 16.6% in deal count in 2024, surpassing pre–COVID-19 averages. Similarly, EV / EBITDA exit valuation multiples saw an uptick compared to 2023 as the average multiple grew to 12.7x in 2024 relative to 11.9x in 2023. However, the rebound in exits and valuations was driven by PE firms exiting their best-performing assets to secure a favorable DPI as markets showed signs of improvement after rate cuts.
Other portfolio companies, including the weakest performers, will continue to be held as sponsors await a more forgiving exit environment for their steady and underperforming assets. The average holding time remains at ~6 years, a peak within the last decade.
What This Means for NAV Lending
The trend to hold underperforming assets for longer will continue to drive interest in NAV loans as sponsors will need to attain and deploy capital to grow and stabilize the underperforming assets in their portfolio for an eventual exit.
U.S. Private Capital Secondary Market 2024
Source: Jefferies, Lazard. Volume data as of December 31, 2024; pricing data as of June 30, 2024. Pricing reflects the average percentage of NAV paid in all secondary transaction types during the period.
Secondary market activity continued to accelerate in 2024 compared to 2023 as volume hit a high of $152B. The low distribution rates of primary funds have caused LPs looking for liquidity to look favorably at the secondary market.
The emergence of new buyers (e.g., AEA, Leonard Green) and buyer types (e.g., 40 Act Funds) has brought in a new wave of demand for performing assets in the secondary market, leading to rising prices.
Funds also continue to be brought to the secondary market earlier in their lifecycle as the average age of funds sold fell to 6.4 years, relative to 8.4 years in 2022.
What This Means for NAV Lending
As the market continues to adapt to new technologies within the liquidity solutions market, other capital market tools (e.g., NAV Financing, Management Company financing) have and will continue to experience significant growth in their adoption.
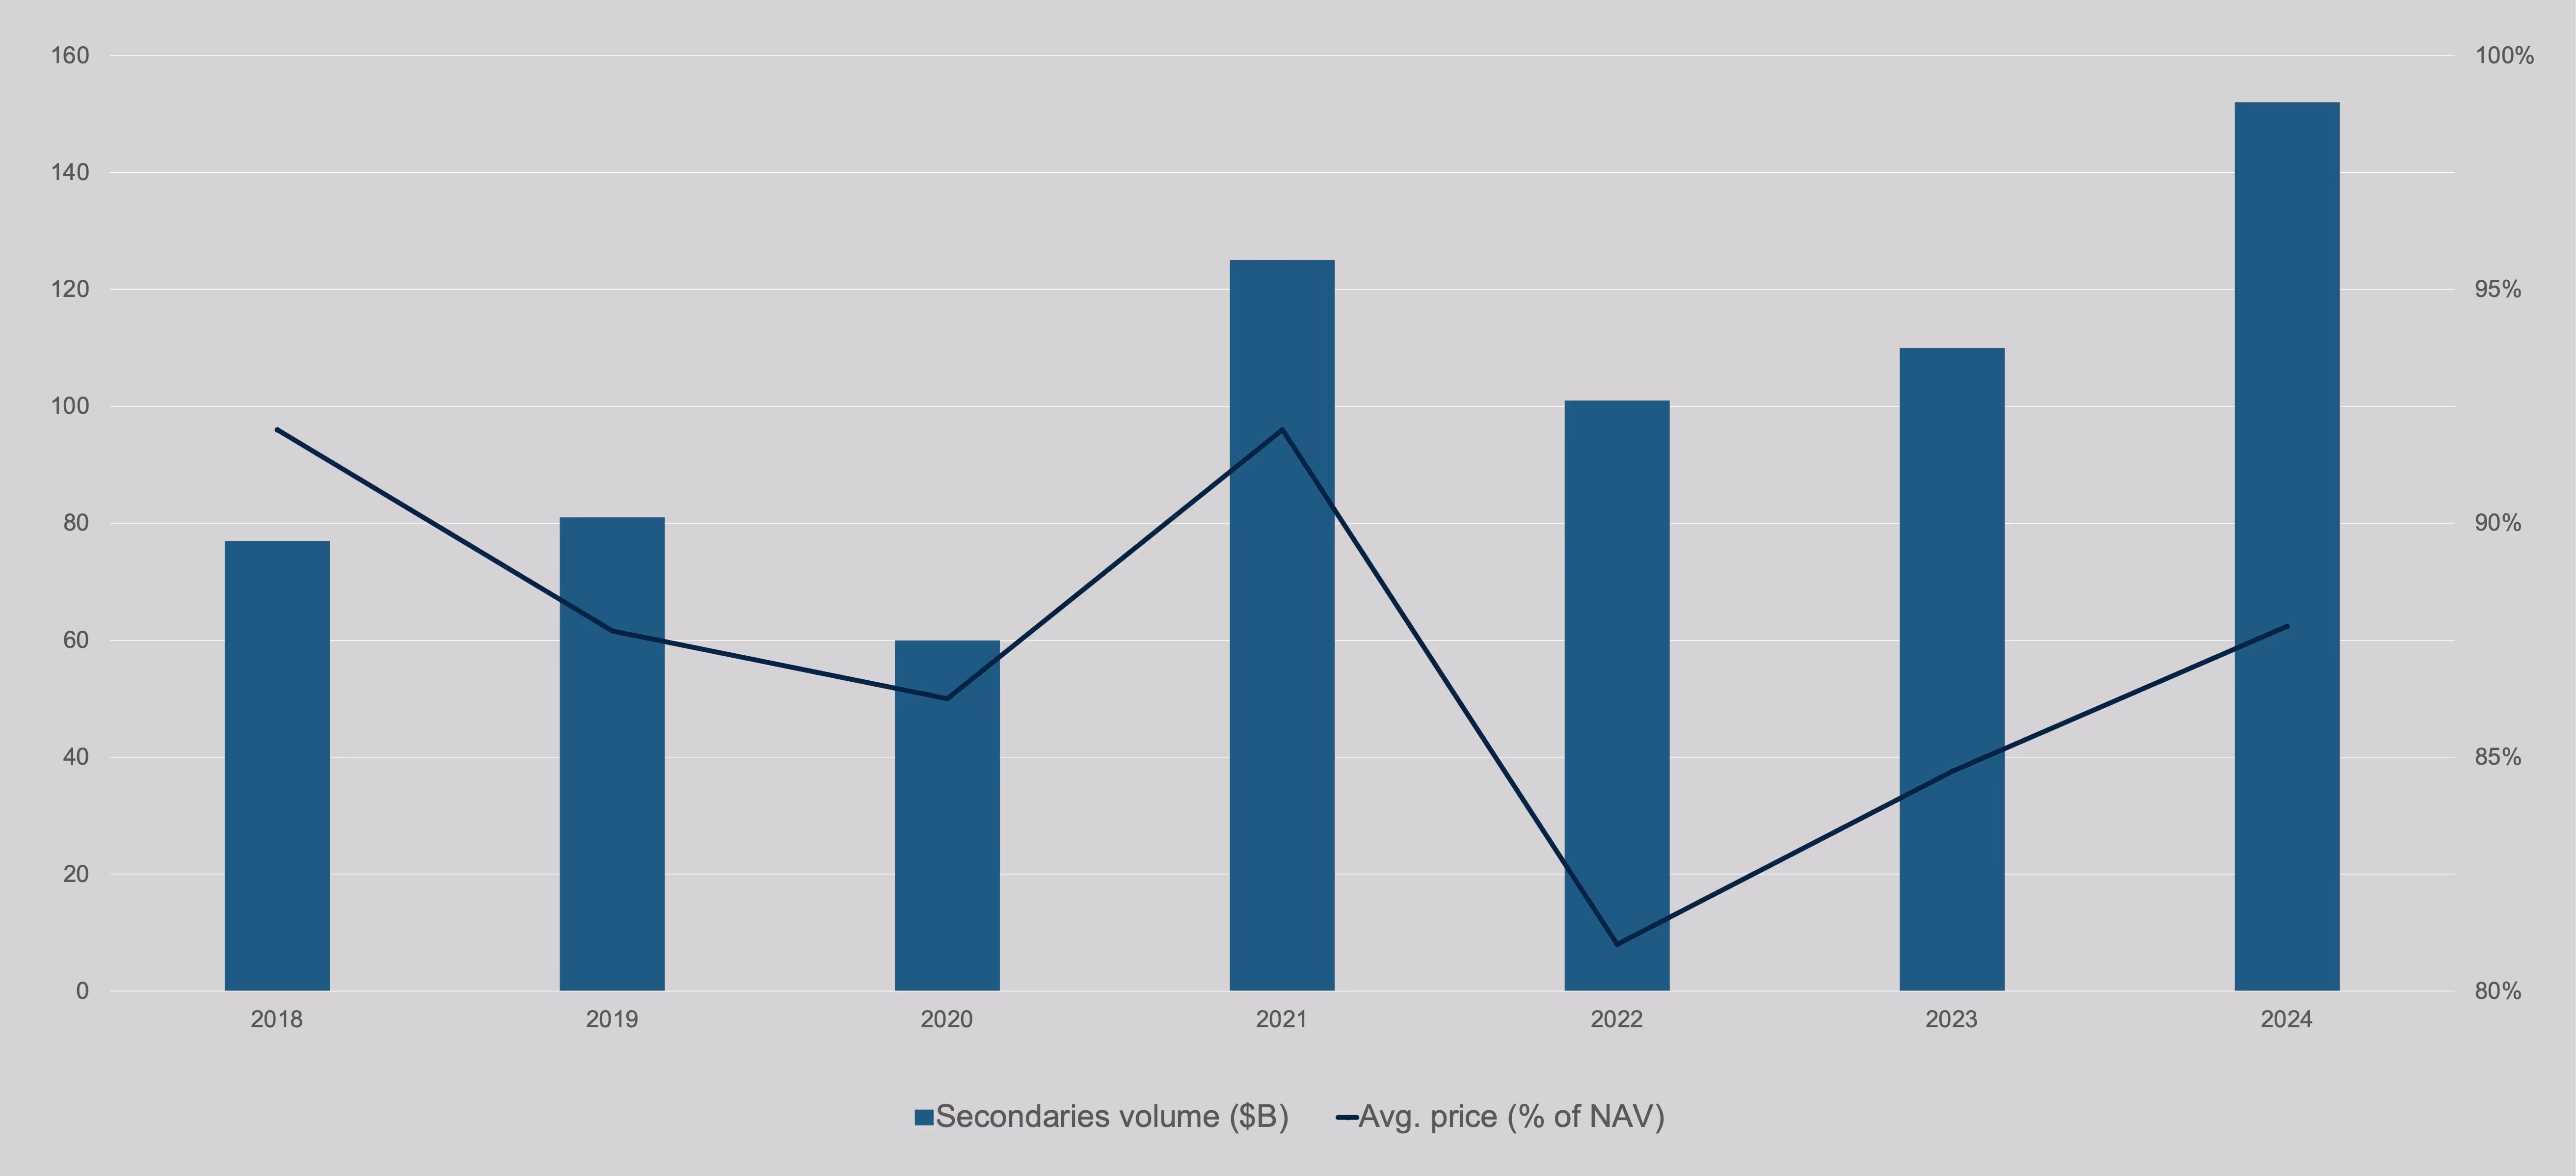
Secondary market activity continued to accelerate in 2024 compared to 2023 as volume hit a high of $152B. The low distribution rates of primary funds have caused LPs looking for liquidity to look favorably at the secondary market.
The emergence of new buyers (e.g. AEA, Leonard Green) and buyer types (e.g. 40 ActFunds) have brought in a new wave of demand for performing assets in the secondary market, leading to rising prices.
Funds also continue to be brought to the secondary market earlier in their life cycle as the average age of funds sold fell to 6.4 years, relative to 8.4 years in2022.
What This Means for NAV Lending
As the market continues to adapt to new technologies within the liquidity solutions market, other capital market tools (e.g. NAV Financing, ManagementCompany financing) have and will continue to experience significant growth in their adoption.
Conclusion
To summarize, the market is seeing green shoots of recovery in late 2024 and beyond after the exit flow drought of 2023. This is seen in the higher volume of debt financings, rebounds in exit activity, increased secondary activity, and increased valuation multiples.
However, “not all that glitters is gold,” and the underlying drivers behind these trends show that sponsors still have much work to do:
- The increase of debt volume was mostly refinancings as debt markets continue to get more competitive for sponsors’ strongest assets. Financing for “storied credits” remains a challenging endeavor.
- The increase in exits and valuations was primarily the result of sponsors monetizing their strongest assets. Stable and underperforming companies will remain in their portfolios for longer and could drive demand for NAV loans as sponsors will need to deploy additional capital to grow and stabilize them.
Although PE portfolios are still not out of the woods, NAV lending is here to stay and will become more relevant as sponsors seek to stabilize and create value in their investments.
